
Last year, when I was still playing fairly frequent online chess, I noticed that some days I would have performance of a complete beginner, according to the applied computer analysis, and an above expert level performance the next day. While generally sitting in the middle at the lower-intermediate level for a while, having the same peaceful and content day and good sleep both days. It had me thinking…
This wouldn’t just apply to chess, but every ability in every human. Including art. I wondered whether this kind of oscillation/range/fluctuation has a name. Was it studied or researched? Are there people with narrower ranges that can consistently perform on higher levels? What does it mean if you are a big-range fellow, or a narrow range, high focus individual? What makes them different? Is it nature or nurture? Could you become the other type with practice? How comes nothing would wane the narrow range performer, if they are super consistent? Would a wide-range type have better chances /outcomes in creativity?
All in all: what explains this difference?
I drew this rough idea:
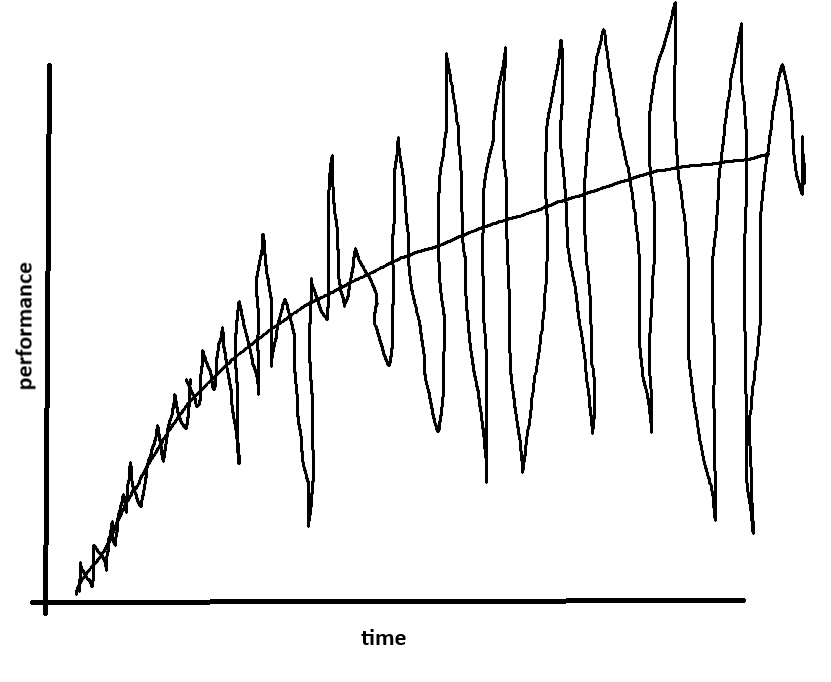
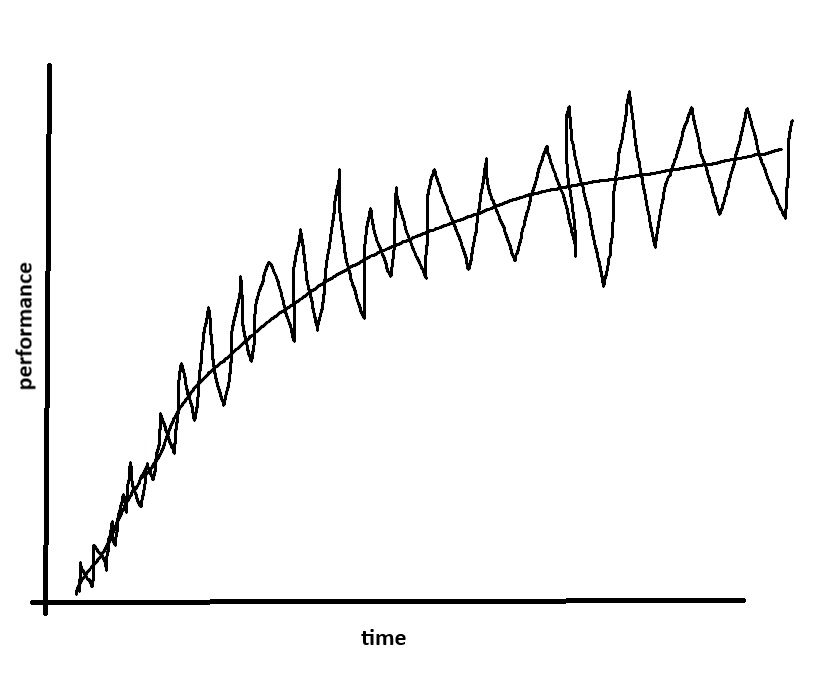
Internet research revealed that the closest to a name to this phenomenon called what I titled this post, or “within-person variability”. This is a legitimate scientific research question that has been studied. Primarily in cognitive psychology, performance psychology, psychometrics and statistics, with connections to expertise and creativity research.
But of course! The progression of abilities usually look like a stock-chart in an upward trend. There are dips and there are jumps, so growth goes in waves. My focus is on the above illustrated differences. What is the norm in the general population, or does it fully spreads, and differs from person to person? Does one mean something is wrong, or better functioning, so would this flag something that worth checking out with a doctor? Can the wide-range one learn to narrow it down, and if yes, how? As I write these questions, some of the answers are popping in straight away, but then this post would be too long, and I want to keep it short.
I just wanted to let this thought out, and explore it a bit more. But I found a fairly good and thorough description, for further read.
By the way: I would call the above “big-range graph” a fish-type performer, because that’s all I can see when I look at it. A fish-bone without the head.
Okay, a quick search revealed that Fishbone diagram is already a thing, and that’s different from this one. Nevermind. I learned two things today.
It still made me want to generate this:

Okay. While I was looking at images under this subject, I saw one of my questions answered in the form of this:
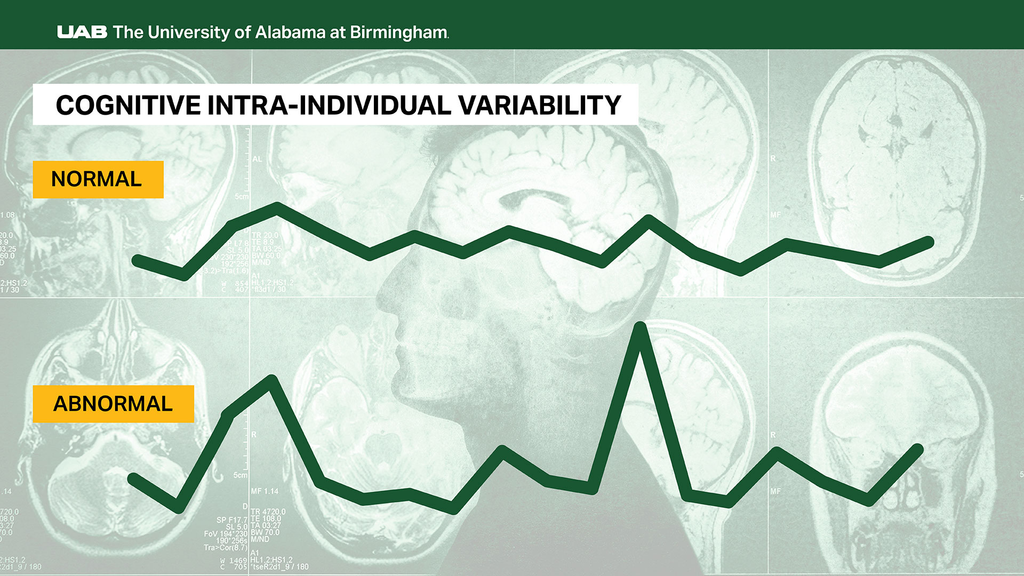
I know these studies are mostly concerned with serious brain issues, and not in the way I was interested, but maybe there is a correlation and I should talk to my doctor? lol